
Observability
Structured logging with Winston and distributed tracing with OpenTelemetry - two complementary signals, how they fit together, and how to see traces locally.
Two signals, one picture
The template ships with two observability layers that complement rather than replace each other:
| Signal | Tool | What it tells you |
|---|---|---|
| Structured logs | Winston (rootLogger) | What happened, at which layer, with what context. Filterable by logSource and scope. |
| Distributed traces | OpenTelemetry | How long each part of a request took, which spans were nested inside which, where the time went. |
Logs answer "what happened?". Traces answer "where did the time go?". Both are useful; neither replaces the other.
For the full logging reference - logSource vs scope, verbosity knobs, the
DB query diagnostic - see Logging.
What Next.js traces automatically
Next.js has OpenTelemetry baked in. Once the SDK is registered (via
src/instrumentation.ts), these spans are emitted for every request with no
additional code:
| Span | When it appears |
|---|---|
[http.method] [next.route] | Root span for every incoming request - HTTP method, route pattern, status code |
render route (app) [next.route] | App Router route rendering |
fetch [http.method] [http.url] | Every fetch() call made from server components, actions, or route handlers |
executing api route (app) [next.route] | API route handler execution |
generateMetadata [next.page] | Metadata generation per page |
resolve page components | Page component resolution |
Each span carries next.route, next.span_type, and standard HTTP attributes.
Set NEXT_OTEL_VERBOSE=1 to surface additional internal spans (segment
resolution, layout loading, response start).
Local development
To see traces locally you need a collector (receives OTLP from Next.js) and a visual backend (Jaeger). Both run as Docker services.
How the pieces connect
Next.js app
    │  POST /v1/traces (OTLP)
    ▼
OTel Collector :4318   ← OTEL_EXPORTER_OTLP_ENDPOINT points here
    │  batches and forwards
    ▼
Jaeger :16686          ← open this in a browser
:4318 is a data ingestion endpoint - not a UI. The collector receives spans
from Next.js, batches them, and pipes them into Jaeger. :16686 is the Jaeger
web UI where you actually view traces. The collector exists so you can swap
the backend (Jaeger → Grafana → Honeycomb) without changing the app.
Start the OTel stack
docker compose -f docker-compose.otel.yml up -dThis brings up:
- OTel Collector on ports
4317(gRPC) and4318(HTTP) - Jaeger UI at http://localhost:16686
Stop the OTel stack
docker compose -f docker-compose.otel.yml downTrace data is not persisted - Jaeger stores everything in memory so it clears on each restart.
Point Next.js at the collector
Add to .env.local (copy from .env.local_template):
OTEL_EXPORTER_OTLP_ENDPOINT=http://localhost:4318
NEXT_OTEL_VERBOSE=1
Restart the dev server after setting these.
View in Jaeger
Generate some traces by browsing a few pages in the app,
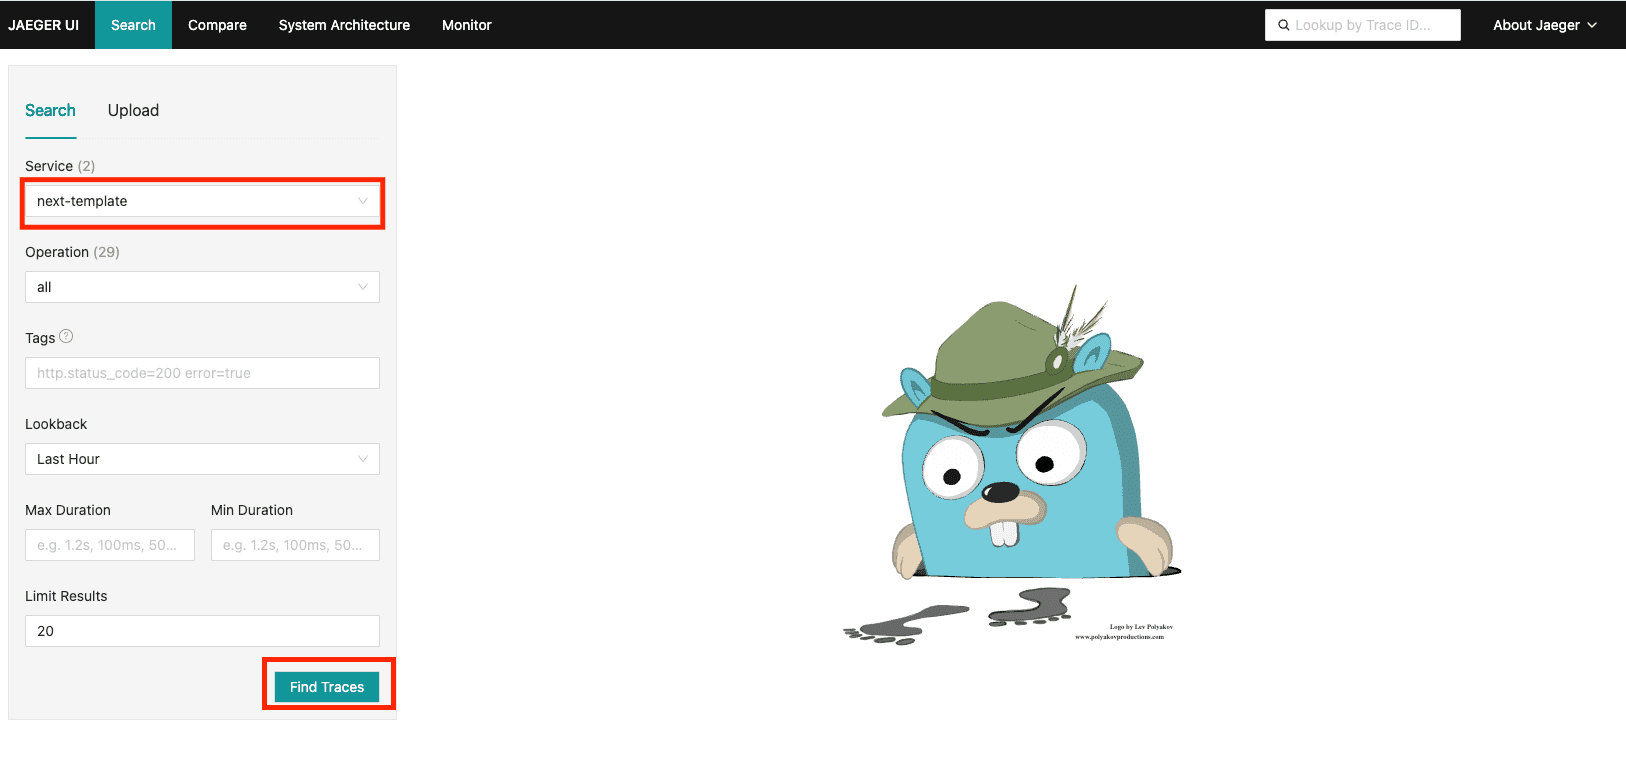
Open http://localhost:16686. Traces don't appear automatically - you need to search for them:
- Select next-template from the Service dropdown
- Click Find Traces
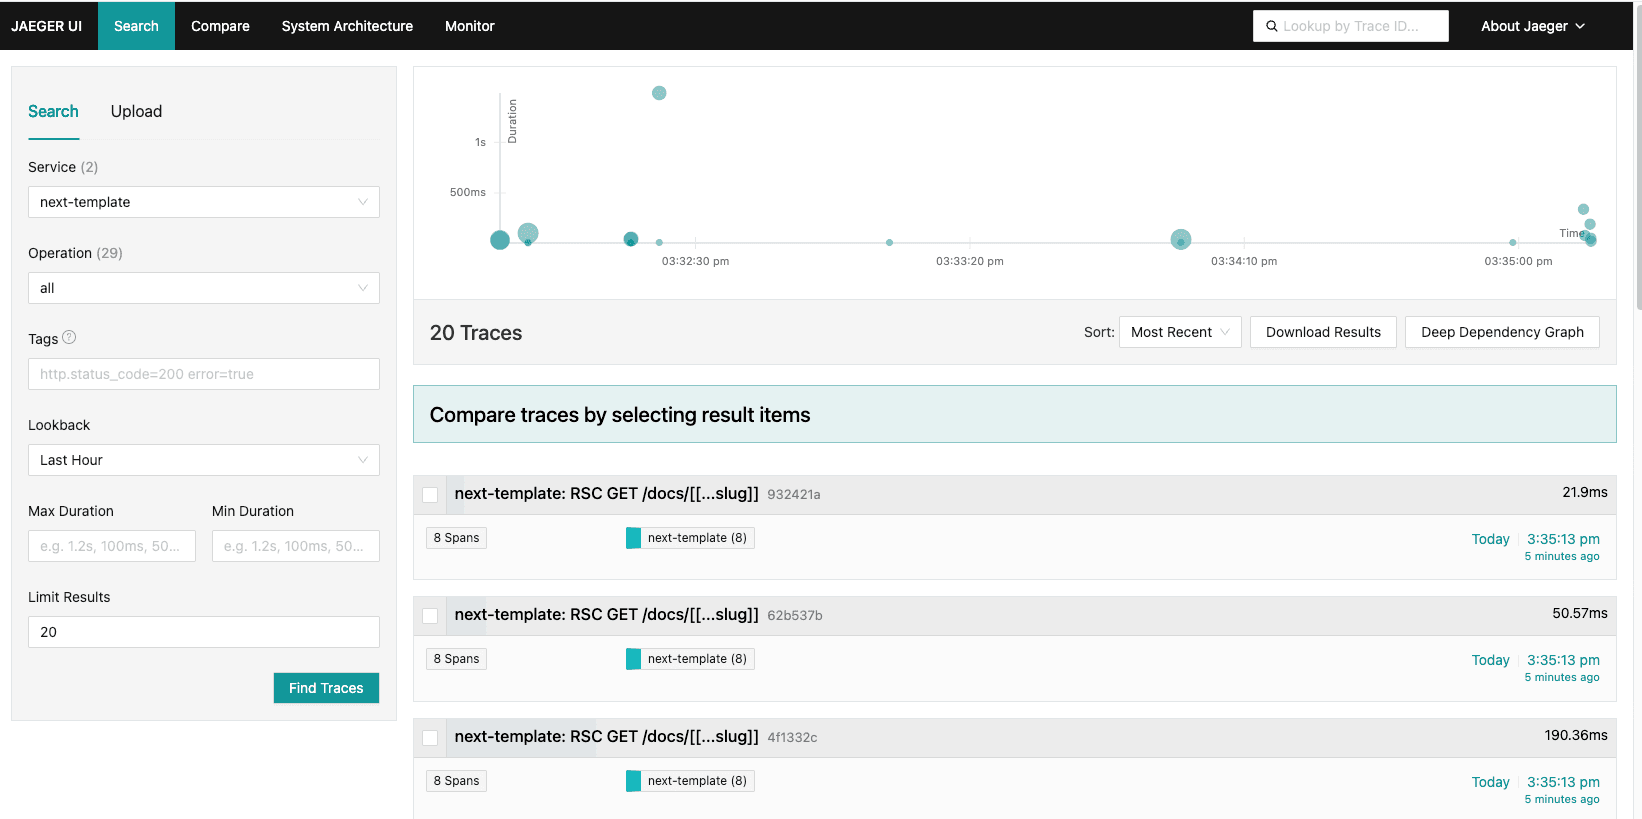
You'll see a list of recent traces, one per request. Click any trace to open the waterfall - root span at the top, nested child spans beneath it showing rendering, fetch calls, and route handler execution with millisecond timings.
No traces appearing? Make sure OTEL_EXPORTER_OTLP_ENDPOINT is set and the
dev server was restarted after adding it - Next.js reads env vars at
startup, not at request time. Check the collector is receiving data with:
docker logs next-template-otel-collector --tail 20.
How it's wired
src/instrumentation.ts - Next.js calls this file's register() export
once before the app starts in each runtime (Node.js and Edge). It registers the
@vercel/otel SDK with the service name next-template. No other files need
to change - Next.js picks up the instrumentation hook automatically.
import { registerOTel } from '@vercel/otel';

export function register() {
  registerOTel({ serviceName: 'next-template' });
}
No endpoint = no export. When OTEL_EXPORTER_OTLP_ENDPOINT is unset (CI,
local dev without a collector), the SDK initialises but sends nothing. There is
no runtime cost and no errors.
Custom spans
To trace a specific function, use the @opentelemetry/api package (already a
transitive dep via @vercel/otel):
import { trace } from '@opentelemetry/api';

export async function fetchExternalData() {
  return trace
    .getTracer('next-template')
    .startActiveSpan('fetchExternalData', async (span) => {
      try {
        return await callSomeApi();
      } finally {
        span.end();
      }
    });
}
The span is automatically nested inside whatever parent span is active at call time, so it shows up in Jaeger under the right request.
Production
Deploying to Vercel
If you deploy to Vercel, instrumentation.ts is all you need - no extra
configuration required. Vercel automatically picks it up and gives you two
things for free:
Session Tracing - in the Vercel dashboard, open the toolbar on any preview or production deployment and enable Session Tracing. Vercel captures infrastructure, rendering, and fetch spans for every request you make during that session and surfaces them in Logs → Traces. Good for ad-hoc debugging without a vendor account.
Trace Drains - when you want traces in a persistent backend (Datadog, Grafana, Honeycomb), install the integration from the Vercel Marketplace. All routing happens on the Vercel side - no env vars or code changes needed in the app itself.
Session Tracing and Trace Drains only work when you use @vercel/otel. If you
swap to the manual OpenTelemetry SDK, you lose both. This is why the template
uses @vercel/otel rather than configuring the SDK directly. You do not
need to switch away from @vercel/otel to use your own observability vendor -
it sends to any OTLP-compatible endpoint via OTEL_EXPORTER_OTLP_ENDPOINT.
Only switch to the manual SDK if you hit a specific config wall (custom
sampler, multiple exporters, non-OTLP protocol).
Self-hosting or a custom vendor
Point OTEL_EXPORTER_OTLP_ENDPOINT at your collector or vendor's OTLP
endpoint. No code changes needed - the same instrumentation.ts works
everywhere:
| Vendor | Endpoint |
|---|---|
| Grafana Cloud | https://otlp-gateway-<region>.grafana.net/otlp |
| Honeycomb | https://api.honeycomb.io (+ OTEL_EXPORTER_OTLP_HEADERS) |
| Datadog | https://trace.agent.datadoghq.com |
| Self-hosted collector | Your own OTLP endpoint |
Most vendors also require an API key via OTEL_EXPORTER_OTLP_HEADERS:
OTEL_EXPORTER_OTLP_HEADERS=x-honeycomb-team=your-api-keySet these in Vercel Project Settings → Environment Variables, or in your
platform's equivalent. Next.js 15+ detects instrumentation.ts automatically.